
For a while now I have used LLMs to automate parts of my work. One of those parts is debugging hard problems with Xdebug. Before, I set the breakpoints by hand and built complicated requests to see what happens inside. It usually took a few requests, and I had to move the breakpoints again and again. Then I found that PhpStorm has Xdebug in its MCP server. For simple GET requests, that is enough. But it fails on endpoints that need authorization, and on any method other than GET. So I did not wait for JetBrains. I wrote my own small MCP server, and it makes this work much faster. I share this tool with you, and I hope it helps you too — especially if you work with Docker.
TL;DR
Tired of reading, and you have not started yet? Fair enough. Straight to setting up the MCP server in PhpStorm, or straight to installing xdbg.
AI agents are good at debugging from code alone — until the bug lives in runtime state. Then you need Xdebug, and every existing Xdebug tool is built for humans clicking through a GUI. PhpStorm ships an MCP server since 2025.2, but it is GET-only, has no headers, no path for CLI in Docker, and no control over Xdebug inside the container. So I built xdbg: an MCP server that gives an agent the full loop — enable Xdebug, set a breakpoint, fire a real request, step, inspect, detach.
MIT licence, one-line install, works with Claude Code, opencode, Cursor and any MCP-capable client. Source: github.com/crazy-goat/xdbg
Written against xdbg v0.1.1 (Go 1.26), Docker 29.7.2 / Compose 5.5.0, and any PHP 8 image with Xdebug 3. PhpStorm checked on 2025.2 and again on 2026.2.1.
The mighty duo: var_dump and die
This is the standard. You need to check something fast, so you print the value and stop the script. It is quick, it always works, and it needs no setup.
function add(int $a, int $b): int
{
    $result = $a + $b;
    var_dump($result);
    die();
}
It also has costs. You are editing the code in order to debug it, and you only see the one place you thought to print. Inside a loop, var_dump fills the screen a thousand times and you scroll for the single line that matters. And die() gives you exactly one breakpoint: it kills the process on the spot, so you cannot continue and see what came after it. That hurts most in an event loop, where the state you actually want often shows up on the second pass — and die() never lets you get there.
Analysis by an LLM
Most bugs come straight from the code, and an LLM finds those much faster than any debugger. You paste the stack trace, you show the file, and you have an answer in seconds. But this method has a clear limit. With harder problems, with your own framework, or with anything the model has not seen before, there is a real chance the LLM will invent a problem instead of finding the one you have.
For example, this one. php-fpm kept dying with a segfault, but only on Colima. The LLM was sure the fault sat in the container runtime: first Colima, then Podman, then Rosetta. Every answer sounded reasonable, and every one of them was wrong. It changed its mind only after I asked it to write a test — and then it found that the bug was in PHP itself, and had been there for years. The story of that hunt is here.
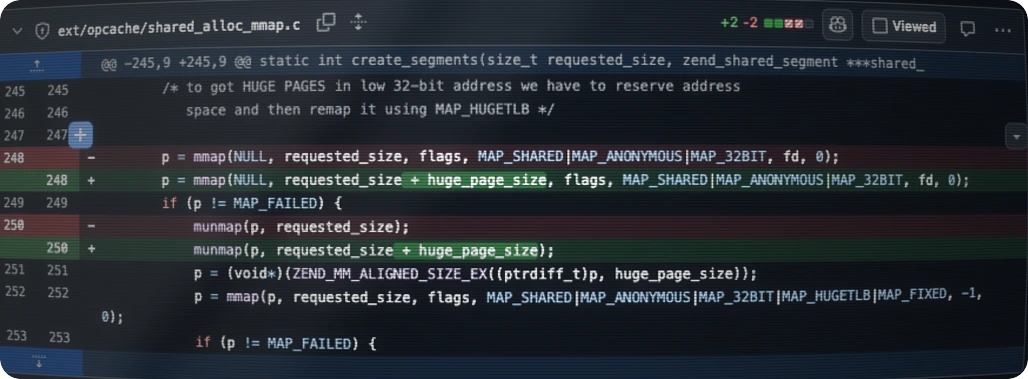
ext/opcache/shared_alloc_mmap.c. OPcache now reserves requested_size + huge_page_size before it remaps the block with MAP_HUGETLB, so a kernel that fails halfway cannot leave a hole behind. Nothing an agent could have guessed from my application code. Click to open full size.And a made-up answer looks exactly like a correct one, so you need a cheap way to tell the two apart.
Debugging with tests
That cheap way is a test. Ask the LLM to write one that proves the problem is real: if it was right, the test fails for exactly the reason it gave you, and if it made the problem up, the test passes and you have lost two minutes. Either way you now know, and you also keep the test. From my experience, a bug is very often a feature that somebody forgot about. A test written this way also writes that feature down, so the next person does not have to guess what the code was supposed to do. It costs a little more time than a quick print, and it gives that time back later.
But some bugs are very hard to put into a test. The state that breaks them only exists in the running system — the real database, the real queue, the real timing, a service that answers differently today than it did yesterday. A test has to pretend all of that, and it pretends what you already believe. For bugs like these you have to look at the living thing, so you need something else.
Manual debugging in the IDE
That something else is a real debugger. For a human the most comfortable one is an IDE like PhpStorm. You set the breakpoint by hand, you fire the request, and you walk through the code line by line, looking at the state as you go. It works, and for a long time it was the only way. But it has costs. You have to know where to put the breakpoint before you know what is wrong, so if you guess badly you start again. Every repeat means the same clicks: listen, fire the request, step, look. And one wrong choice — step into instead of step over — can cost you a lot of time, because now you are ten frames deep inside framework code you never wanted to see.
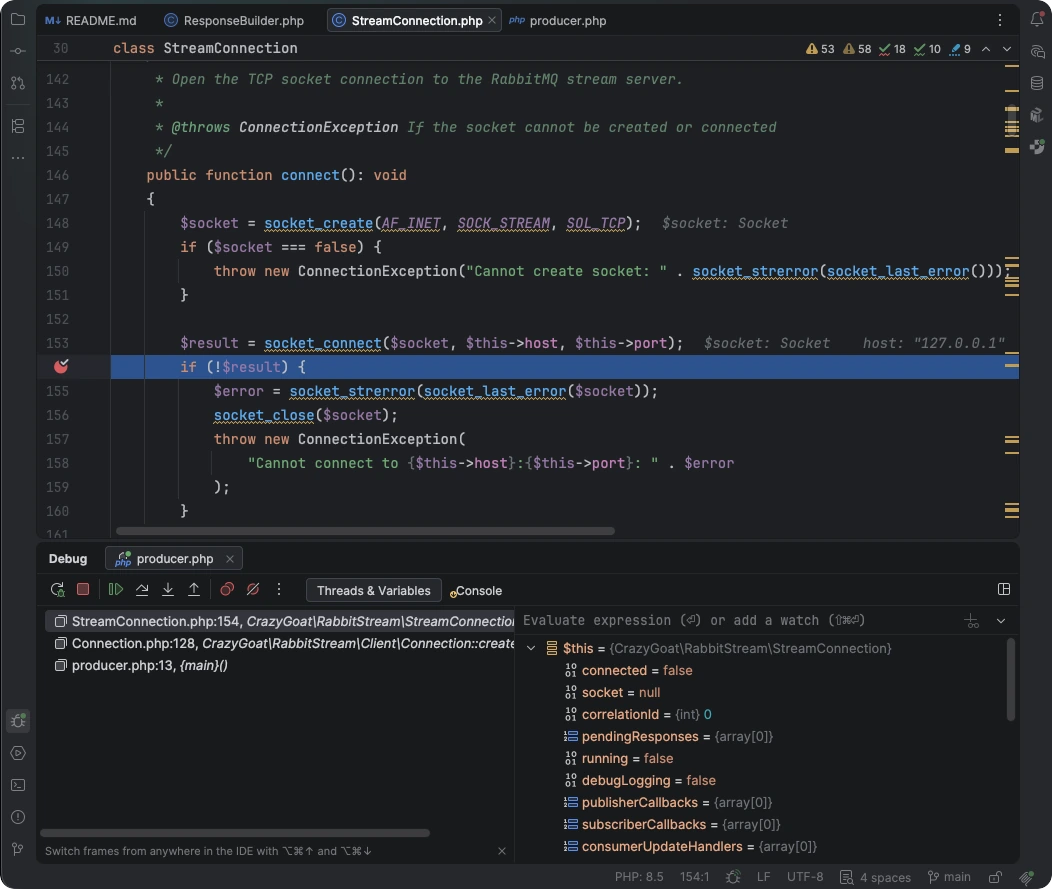
StreamConnection.php:154, three frames deep, with $this open. Every part of this I had to ask for by hand — where the breakpoint goes, when to run, and each step after that. Click to open full size.And here is the part that annoys me most, which is not PhpStorm’s fault at all: I forget to turn the debugger off. Then I run the tests, or a linter, or just one ordinary request, and the process stops somewhere for no visible reason. The classic version goes like this. I have tested the fix, it works, so I tell myself: full test suite and then I am done for the day. I start the suite and go to make a drink, because the suite takes a while. I come back, and nothing has moved — the tests are sitting on a breakpoint. Then I complain quietly to myself for forgetting again. I would like to blame my memory, and at my age that excuse comes more easily every year. There must be a better way.
The simplest path: PhpStorm MCP
And there is. The fastest path to automating Xdebug is PhpStorm — since version 2025.2 it ships with its own MCP server. Go to Settings → Tools → MCP Server, click Enable MCP Server, auto-configure the client — Claude Code, Cursor, opencode — and you are in the game. The plugin is installed by default, so there is nothing to fiddle with.
A predefined set of Xdebug tools is ready out of the box: setting breakpoints (xdebug_set_breakpoint), starting a PHP server (xdebug_start_server), making URL requests (xdebug_request), stepping through code (xdebug_step_into, xdebug_step_over, xdebug_step_out), inspecting the stack and context. You start a debugging session without leaving the chat — like opening the fridge and discovering there is a warm dinner inside.
The flow is different from manual debugging. Instead of clicking around yourself and deciding where to place a breakpoint, you write a prompt describing the problem and ask the agent to use Xdebug through PhpStorm to find the cause. The agent analyses the code, sets breakpoints on its own where it suspects the problem, then drives the session step by step: reads the stack, inspects variables, dives deeper into calls. If the runtime goes down a different path than expected, it moves the breakpoint, repeats the request, and analyses again. All by itself.
For a start this is close to ideal. But in its current form it comes with a few limits, and they are not small print — they change how you work.
Where PhpStorm MCP stopped being enough
None of what follows is a complaint about PhpStorm — it is a very good IDE and its MCP server does what it set out to do. It is a description of the shape of our problem, which happens to sit outside that shape. I first hit this on PhpStorm 2025.2, and it is still the same on 2026.2.1 — four releases later.
The biggest one is simple: PhpStorm has to be open, and it has to be open on the right project. The MCP server is the IDE, so the debugger only exists while the window is running and pointing at the code you care about. Switch project, or close the IDE to free some memory, and the agent loses its tools in the middle of a session. It also means the agent shares the debugger with you: your breakpoints, your listening state, your run configurations.
The next thing is not really a flaw at all: not everyone has PhpStorm. It is currently the default IDE for many PHP developers, but let us be honest — for people starting their careers the licence can be too expensive, and some simply prefer something else. For them this path is dead from the first minute — a party they cannot enter because they are not on the list.
The rest is about what it does not reach — and almost all of it comes down to one thing: it works as if Docker were not in the picture:
- No control over Xdebug inside the container. PhpStorm MCP does not enable or disable Xdebug in the container — and by default we keep it disabled, because it slows everything down: requests, CLI, tests. Without automatic toggling it is easy to forget to turn it off, and then
phpunit,phpstanorcomposer installstop on breakpoints. - Host ↔︎ container paths. The MCP surface works in host paths — hand it a container path like
/var/www/app/src/Kernel.phpand it refuses outright withFile not found. That part is honest. The trap is what comes next: pass the host path and you get back"Breakpoint created.", but whether that breakpoint ever hits depends on path mappings configured on the IDE side, which the agent cannot see, verify or repair. It receives a confident success and then silence — and starts moving the breakpoint one line at a time trying to work out why nothing stops. - No path to a command already running in a container. Debugging
bin/console app:fooinside Docker is possible, but only through a run configuration someone created by hand in the GUI, backed by a docker-compose interpreter. The MCP surface cannot create one, andxdebug_start_debugger_sessiontakes only an existing configuration or a localfilePath+line— there is no attach-to-running-process mode. So a worker or a cron job that is already executing is out of reach. - GET only, no headers.
xdebug_requestsupports only GET and does not allow setting headers. In real API work — POST/PUT/PATCH with JSON, a JWT inAuthorization, cookies,Content-Type— that is simply not enough. - The port is held for the whole session. PhpStorm MCP starts a session and keeps port 9003 occupied until you turn it off yourself. The agent often forgets, then runs tests — which hang on breakpoints because Xdebug keeps stopping the runtime.
- Conflicts on port 9003. When the port is occupied you have to manually work out what is listening and which tool is holding the connection.
- No good documentation. The official docs list the functions but do not describe the process — how to combine them into a working flow. The LLM knows what tools exist, but has to figure out by itself how to use them in practice.
If not PhpStorm, then what?
Two MCP servers for Xdebug already existed, and it is worth knowing what they do. koriym/xdebug-mcp is trace-first — forward traces, profiling, coverage — and reaches containers by wrapping a command you hand it: xstep --break=… -- docker compose run --rm php …. Its code excludes php-fpm and php-cgi on purpose: CLI binaries only. kpanuragh/xdebug-mcp is closer to interactive debugging — breakpoints, stepping, watches — with proper container path translation configured through a static PATH_MAPPINGS map.
Both of them miss the part I needed. Neither turns Xdebug on and off inside a running container, so you leave it enabled and then wonder why phpunit hangs. Neither fires the request either — you still bring your own trigger, and for a POST with a 1600-byte bearer token that trigger is most of the problem. So with either one, there is still no way to debug an ordinary web request going through php-fpm in Docker, which is what I do most days.
The older tools do not close it either. phpdbg, PHP’s built-in CLI debugger; debugclient, the DBGp client shipped with Xdebug; editor integrations such as VS Code PHP Debug — all of them are designed more for humans than for AI. Each works interactively: typing commands, clicking through a GUI, managing the session by hand. Great for debugging by a human, terrible as an interface for an agent that needs a programmable, automated API.
So I had no choice but to vibe-code my own tool. I had a working prototype after 10 minutes and a usable tool within an hour, using only open-source models available through opencode — which significantly reduced the cost. Funnily enough, writing this article took me longer than preparing xdbg together with the repo and docs.
What the tool actually needed
At first I only wanted xdbg_request, because that was what I needed most, with minimal requirements: GET/POST/PUT/… and passing headers. Coding went smoothly. But it quickly turned out that firing requests is only half the job.
The other half is knowing whether Xdebug is even enabled. Hence xdbg_container_status, xdbg_container_enable, xdbg_container_disable. Enabled Xdebug reduces performance and can block calls such as phpunit. On top of that, the agent would often set a breakpoint, start debugging, and execution never paused — so it would rack its brain over what happened, burning through mountains of tokens on guesswork.
Then came the authorization problem. Debugging very often ended with a 401. First thought: the token expired. I generated another one, it seemed to work, and a moment later there was another 401. It took me a while to realise that our token is around 1600 bytes long and the LLM simply slips when copying it into an MCP function. The same happened when a longer JSON body had to be prepared for a POST.
That is when I came up with passing the body and headers through files. A long token can be prepared in a file, and the JSON can be safely validated with something like jq before sending. That is how xdbg_request_from_files was born — and most of my request problems magically disappeared.
Next: running commands. Very often, to confirm something, it is faster to prepare a simple PHP or Symfony command on the side containing only the minimal code that actually reproduces the problem — instead of entering the whole application, placing breakpoints in five places and praying that the flow reaches the right one. The command has to run inside a Docker container, which created another challenge. With xdbg_run_command this became ridiculously simple: the agent enters the container by itself, runs the command, takes over the session, and you watch it play out.
Finally: manual triggers. Sometimes it is simply easier to trigger something by hand — when a command is started by a scheduler, or when a request comes from the outside through a webhook that is not easy to reproduce from the agent level. Every attempt to force the agent to create such a command ended with wonderful constructions like curl -X POST with three escaped brackets and a pipe to php -r. That is where xdbg_listen came from: the agent arms the listener, and you just snap your fingers and trigger whatever needs triggering.
In total there are more than twenty xdbg_* functions, and for agents that was a problem in itself — they often mixed up the call order, used xdbg_listen instead of xdbg_request, and got lost in the debugging flow like a customer in IKEA without a map. To make life easier for LLMs I added a dedicated skill that shows how to debug and which function is for what: an instruction manual you read once and then know which screw goes where.
Installation
Instead of reading ten pages of documentation and typing flags manually, paste one line into a chat with Claude Code or opencode:
Install and configure this MCP server for me:
https://raw.githubusercontent.com/crazy-goat/xdbg/main/install.md
And that is it. The agent fetches the guide, reads it, installs via go install, adds entries to the MCP configuration, translates host paths into container paths, adjusts flags for your project — and asks for permission before changing anything. Like a good assembly crew: they come in, measure, cut, set things up, and you only point to where the fridge stands.
On top of that, xdbg provides a dedicated AI skill (skills/xdbg/SKILL.md) with context about debugging flows, error recovery and good practices. The skill is installed separately, following the rule that the agent asks before installing — but thanks to it the agent knows which functions to use and in what order, instead of guessing.
What it looks like in practice
You are probably wondering what this kind of agent work looks like in real life — whether you can really debug without touching the IDE, or whether this is just a marketing pitch.
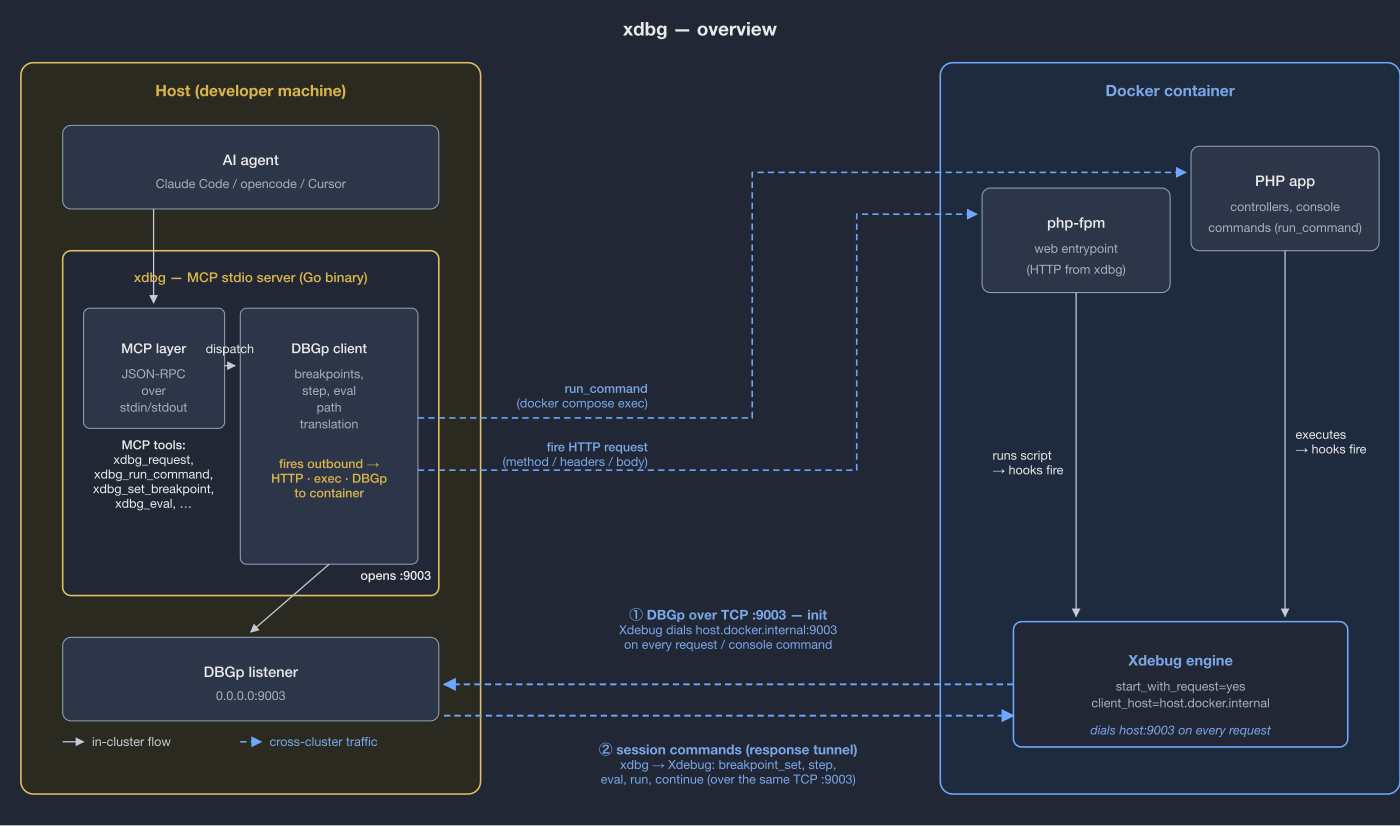
Here is the shape of it. The agent never talks to Xdebug directly — xdbg sits in the middle, holds the DBGp listener on port 9003, and translates between the MCP calls the agent makes and the debugger protocol the container speaks. Path translation happens in the same place, which is what stops the agent from setting breakpoints on host paths that the container has never heard of.
add endpoint writes anything to stderr. It enables Xdebug, breaks in Calculator::add, fires the request, and steps until it finds the culprit — 45 seconds, one chat.A Slim app with a simple GET /calc/add/{a}/{b} endpoint. For larger results, a log suddenly appears in stderr, even though nobody asked for it to be written there. The agent enables Xdebug inside the container, sets a breakpoint in Calculator::add, fires the request — and then drives the session step by step: reads the stack, inspects variables, dives into calls, evaluates expressions, and finds logLargeResult writing to php://stderr on its own. Everything in one chat, without switching tools, without the usual Postman-and-IDE loop.
The pattern is always the same:
enable Xdebug → breakpoint → request or command → step → detach → disable XdebugThe agent takes care of cleanup by itself — it knows to close the session and free port 9003 before running tests. For HTTP, CLI and manual launch the flow is identical; only the trigger changes.
That flow leaves out one thing worth knowing. While the code is stopped, the agent can also change values, not only read them. Set a variable to whatever the failing case would produce, then continue — and you get to watch the unhappy path without building it first. A service that is healthy today but returns an error on Fridays, a payment that comes back declined, an empty result from a query that always finds rows on your machine. By hand this means clicking through the IDE and doing it again on every single run. The agent does it in one step, and it remembers what it already tried.
Summary
xdbg does not try to replace PhpStorm. It tries to pull debugging out of the IDE and put it where it fits the present: into a chat with AI. Between tracing where an exception escaped and discovering where it came from there is an entire afternoon of manual work — and xdbg turns that into a few prompts.
It is a small project on purpose. It solves one problem — driving Xdebug inside a container from an agent — and it has no ambition to grow past that. If JetBrains ships this properly in PhpStorm, or if one of the other MCP servers grows the container side, I will stop developing it and use theirs. A tool that exists because of a gap should disappear when the gap does.
MIT licence, Go, one-line installation. Worth trying and judging for yourself: github.com/crazy-goat/xdbg.